Quantifying the Effectiveness of Scientific Movies and Docs
qualitative and quantitative analysis of what makes a good cinematic scientific visualization in documentaries
How can we tell if a scientific documentary is having the impact on audiences that the visual designers and scientists working on the production expect?
Ongoing collaborations aim to delve into this issue using both qualitative and quantitative methods.
Quantitative Methods
We are currently building on the work on quantifying the effectiveness of social issue-focused documentaries by Prof. Rezapour our group is using natural language processing methods to quantify the effectiveness of scientific documentaries based on the reviews left by viewers on the Amazon and YouTube platforms.
This work is ongoing so check back soon for updates!
Qualitative Methods
In work lead by Prof. Eric Jensen and (former) director of the Advanced Visualization Lab (AVL), PhD student Kalina Borkiewicz.
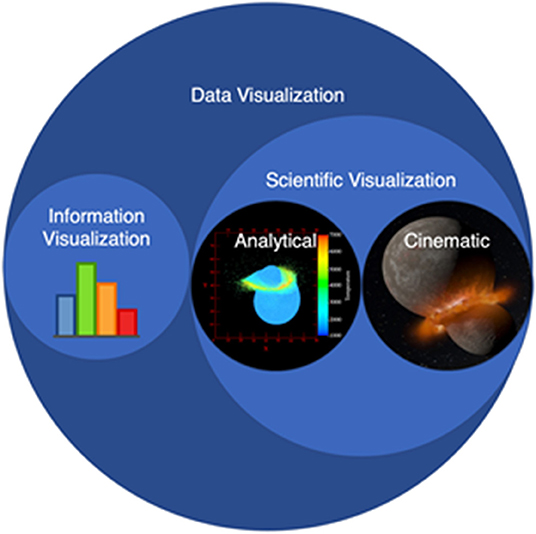
As the AVL focuses on cinematic presentations of scientific data (e.g. documentaries, IMAX movies), the first task was to define the field of “Cinematic Scientific Visualization” (CSV) as a unique subset of the field of scientific visualization (Borkiewicz et al., 2022).

Ongoing work has focused on understanding how the choices that visual designers make impacts the enjoyment and understandability of a cinematic scientific visualization.

References
2024
-
Transforming Science Narratives? The Impact of Explanatory Labels of 3D Data Visualization on Public Understanding of Space ScienceInternational Journal of Science Education, Oct 2024
-
Picture Perfect Science Communication: How Public Audiences Respond to Informational Labels in Cinematic-Style 3D Data VisualizationPLOS ONE, Oct 2024
2023
-
 Evidence-Based Methods of Communicating Science to the Public through Data VisualizationSustainability, Oct 2023
2022
-
 Introducing cinematic scientific visualization: a new frontier in science communicationImpact of Social Sciences Blog, Oct 2022
 -
 A new frontier in science communication? What we know about how public audiences respond to cinematic scientific visualizationFrontiers in Communication, Oct 2022
 -
Evidence-based science communication: through cinematic scientific visualizationIn ACM SIGGRAPH 2022 Courses , Oct 2022